Spotlight
How to Use IPv6 With AWS Services That Don't Support It
Build an IPv6-to-IPv4 proxy using CloudFront to enable connectivity with IPv4-only AWS services.


[If you don’t care to hear some background about Datadog skip to Step 0. Preparation section]
Trek10 has deep roots with Datadog. We use it extensively for our clients who trust us with supporting their AWS environment 24x7 and we also help clients implement Datadog with professional services. Depending on which generation you identify with you might call me one of the following terms:
I constantly get asked the question: “What is the most powerful feature/differentiator for Datadog?” I think people expect me to say a specific service Datadog offers such as “Their logging tool is great, lets you filter, etc.” but what I get jazzed up to say is “Datadog’s best feature and differentiator is how they let you visualize and monitor on any data inside of Datadog as much as you want for FREE”. That’s right you can create as many dashboards and monitors on the data inside of Datadog at no extra cost. If you are like most people my favorite feature is leaving you underwhelmed as a “best feature” … but I think the underwhelming sense comes from a lack of concrete examples. So in this post, I’m going to show off how simple it is to get data in Datadog and how to easily create powerful dashboards/monitors on said data.

Much to the chagrin of my financial advisor, family, and myself, I do dabble in purchasing Crypto coins/tokens. I have tried a couple of different ways to get alerts when the price of tokens/coins I follow have price swings and other noteworthy events. Each type of alert I have used has been helpful, but missing the total control I want- namely being able to name the alert, specify exactly when I get the alert, direct the alert in any format I want, and alert on topics other than just price. As one does when they can’t find the tool they want, they build it… or at least v1 of it! I went ahead and built that v1 and I will cover how to feed data into Datadog and create Datadog monitors over the price of both Chainlink (LINK) and Bitcoin (BTC) using Kraken’s API. There will be a bonus section that shows you a rudimentary way to get whale alerts (i.e. if there is a large purchase or sale). If crypto is not your cup of tea you can choose any data feed with an API polling endpoint and still use this blog as a guide.
What you will need:
What you will get:
What you will pay:
We will be using Kraken to retrieve the pricing data for LINK and BTC. This section doesn’t include any necessary steps for the tutorial, but just explanations. If you wish to just copy/paste feel free to skip to Step 2.
If you want to use this as a tutorial for something other than LINK and BTC please use the documentation https://docs.kraken.com/rest/#operation/getTickerInformation and find the current parameter (i.e. ticker) for the CURL request. Otherwise, the steps below show where we get the price information that we will be pumping into Datadog.
curl "https://api.kraken.com/0/public/Ticker?pair=LINKUSD" → this returns a JSON payload of the current market data for Chainlink in relation to US dollarscurl "https://api.kraken.com/0/public/Ticker?pair=BTCUSD" → this returns a JSON payload of the current market data for Bitcoin in relation to US dollars

c as the “current price” of LINK/BTC. It may not be the exact value the market is currently trading at, but it is the value of the last market trade which should be very close. (Note the irony of not using a price feed powered by LINK to determine the price of LINK is not lost on me LINKmarines). v and the difference of that value from the value 1 hour ago to detect major shifts in the amount of LINK/BTC either bought or sold.In this section, we will be setting up a lambda function to grab the price of LINK and BTC every 10 minutes and push that data into Datadog. This step is critical as we need the data inside of Datadog to start taking advantage of Datadog’s features.
I will be trying to explain the concepts and what is happening as I go. At the end of this step, I will give an overview with short and exact steps you need to take. If you get lost or confused try skipping to that section to get the end product and work backward.
Create Function button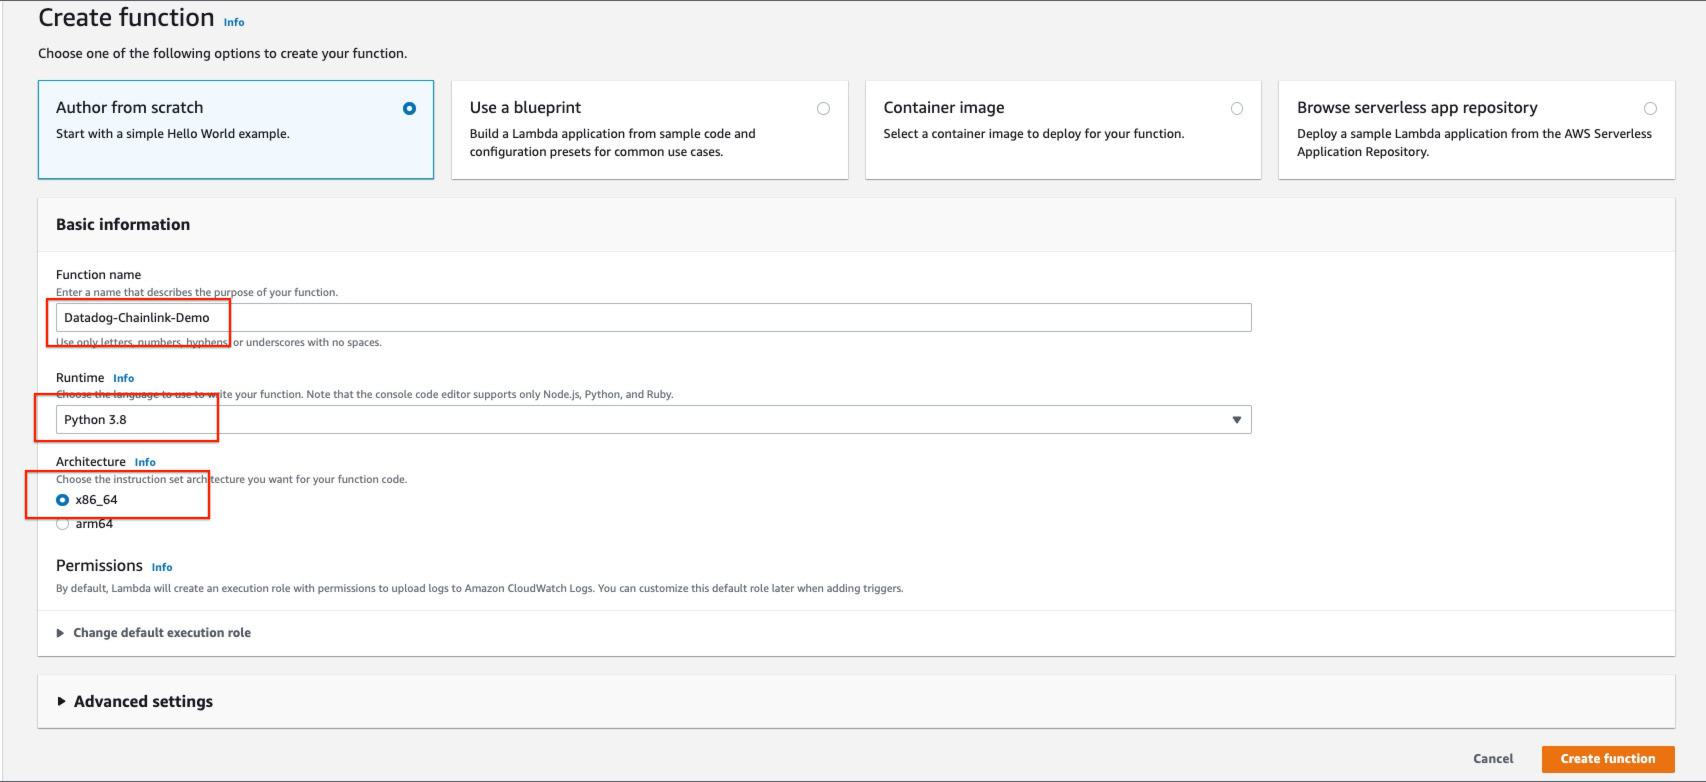
import json to the top (we will need to use this later)import urllib3 underneath http = urllib3.PoolManager() underneath r = http.request("GET", "https://api.kraken.com/0/public/Ticker?pair=LINKUSD") right underneath the handler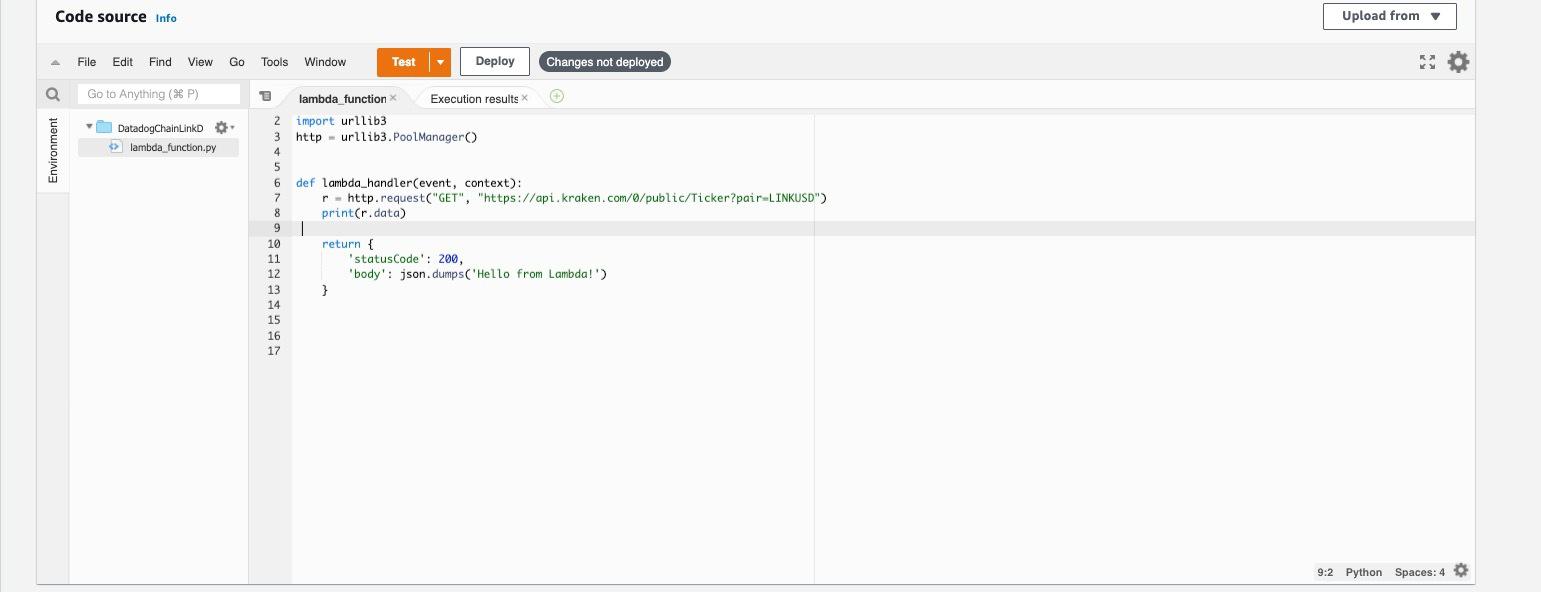
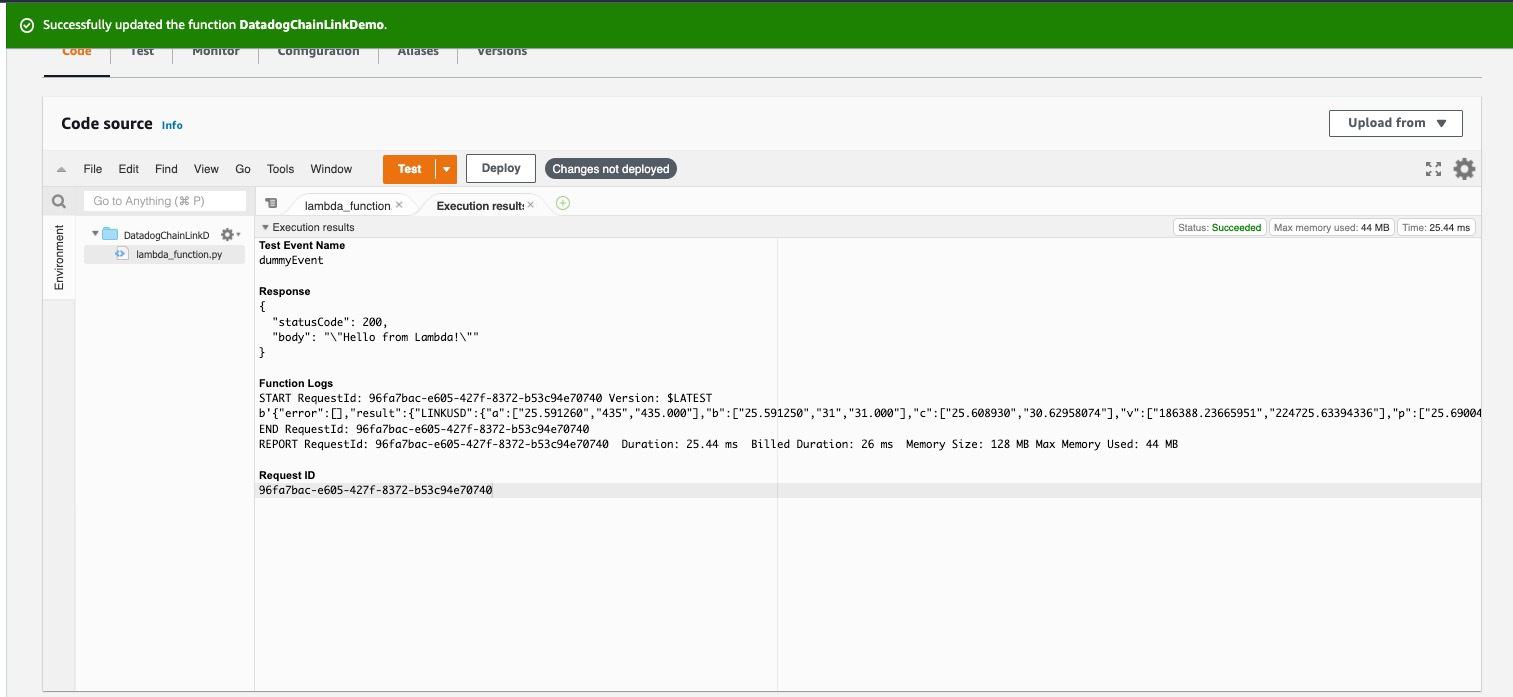
b)data=r.data.decode('UTF-8')data=json.loads(data)data=json.loads(data) line. (Note that if you are wanting to monitor a different Crypto you will have a different ticker rather than LINKUSD to add here).
import json
import urllib3
http = urllib3.PoolManager()

def lambda_handler(event, context):
    r = http.request("GET", "https://api.kraken.com/0/public/Ticker?pair=LINKUSD")
    data=r.data.decode('UTF-8')
    data=json.loads(data)
    current_price=float(data["result"]["LINKUSD"]["c"][0])
    last_24_volume=float(data["result"]["LINKUSD"]["v"][1])
    print(current_price)
Add Layer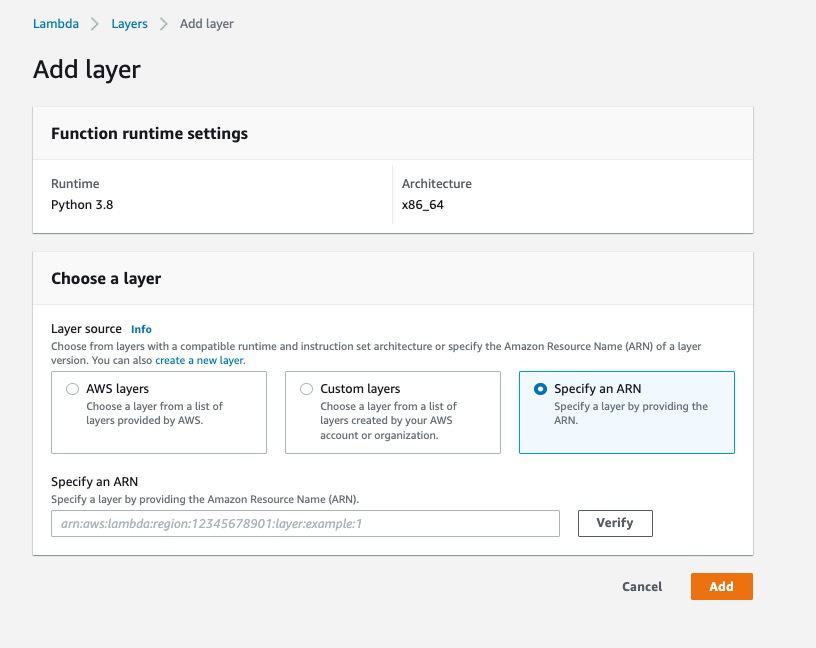
arn:aws:lambda:us-east-2:464622532012:layer:Datadog-Python38:50 since I choose us-east-2 to work in (if you choose a different region, substitute the region, same for python version, etc.)Addfrom datadog_lambda.metric import lambda_metric to the top of your filefrom datadog_lambda.wrapper import datadog_lambda_wrapper to the top of your file@datadog_lambda_wrapper
lambda_metric(
        "chainlink.current_price",              # Metric name
        current_price,                          # Metric value
        tags=['ticker:LINK']                    # Associated tags
    )
    lambda_metric(
        "chainlink.last_24_volume",              # Metric name
        last_24_volume,                          # Metric value
        tags=['ticker:LINK']                    # Associated tags
    )
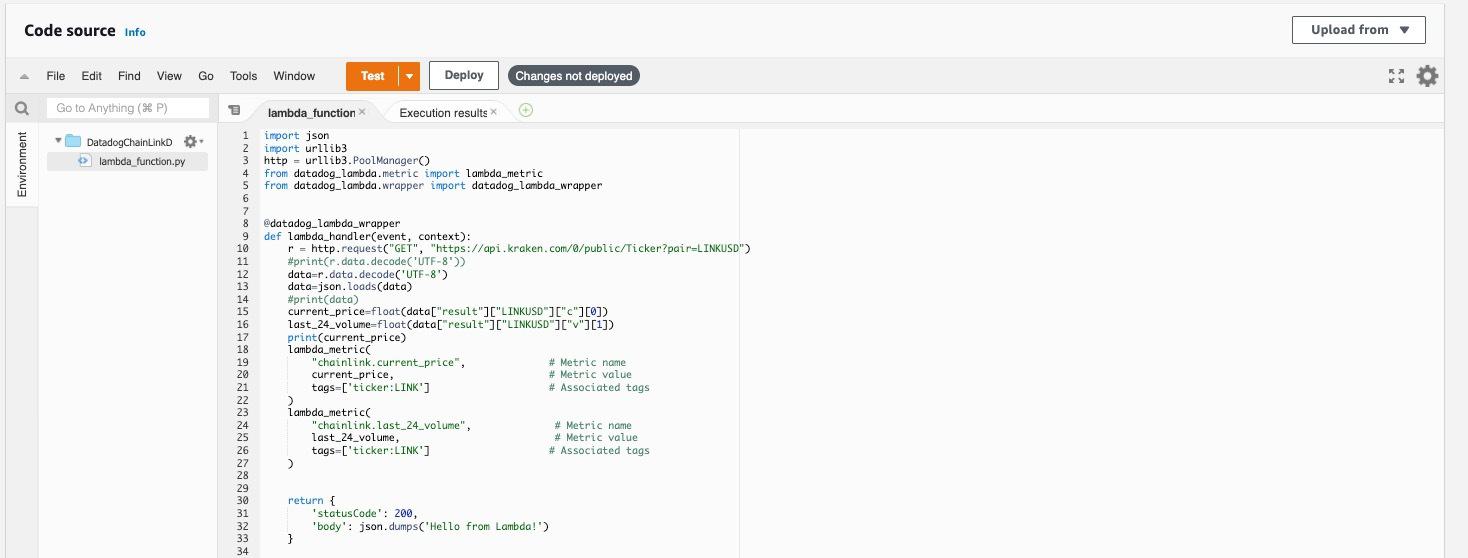
import json
import urllib3
http = urllib3.PoolManager()
from datadog_lambda.metric import lambda_metric
from datadog_lambda.wrapper import datadog_lambda_wrapper


@datadog_lambda_wrapper
def lambda_handler(event, context):
    r = http.request("GET", "https://api.kraken.com/0/public/Ticker?pair=LINKUSD")
    #print(r.data.decode('UTF-8'))
    data=r.data.decode('UTF-8')
    data=json.loads(data)
    #print(data)
    current_price=float(data["result"]["LINKUSD"]["c"][0])
    last_24_volume=float(data["result"]["LINKUSD"]["v"][1])
    print(current_price)
    lambda_metric(
        "chainlink.current_price",              # Metric name
        current_price,                          # Metric value
        tags=['ticker:LINK']                    # Associated tags
    )
    lambda_metric(
        "chainlink.last_24_volume",              # Metric name
        last_24_volume,                          # Metric value
        tags=['ticker:LINK']                    # Associated tags
    )
    return {
        'statusCode': 200,
        'body': json.dumps('Hello from Lambda!')
    }
r =... to the two lambda_metric functions inclusive and paste it again.r = http.request("GET", "https://api.kraken.com/0/public/Ticker?pair=LINKUSD") to r = http.request("GET", "https://api.kraken.com/0/public/Ticker?pair=BTCUSD") current_price and last_24_volume change the keys from LINKUSD to XXBTZUSD chainlink.current_price and chainlink.last_24_volume change those names to bitcoin.xxx and change the tag for ticker:LINK to ticker:BTCFunction overview section and click add trigger.Schedule expression and enter cron(0,10,20,30,40,50 * ? * * *)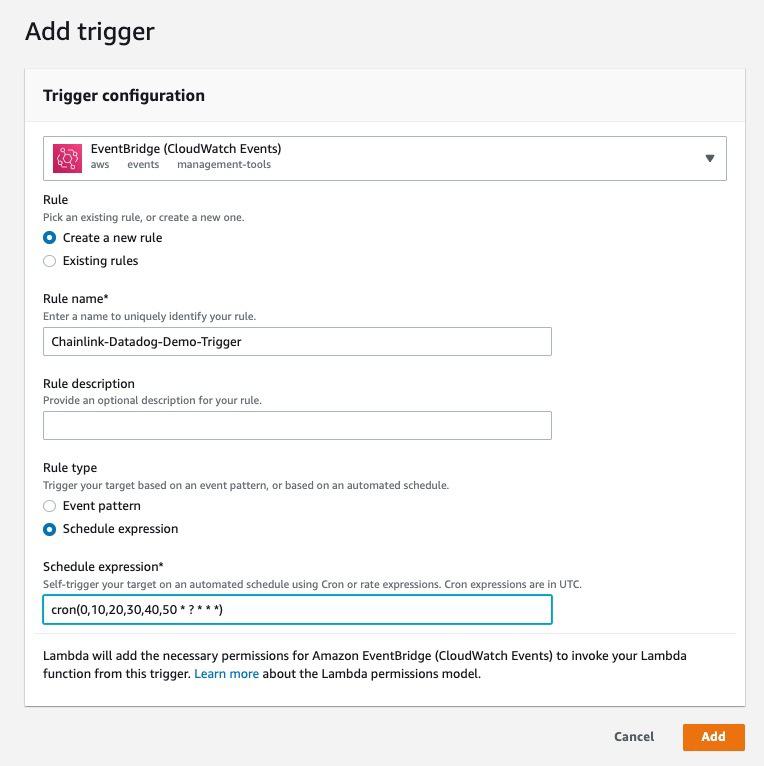
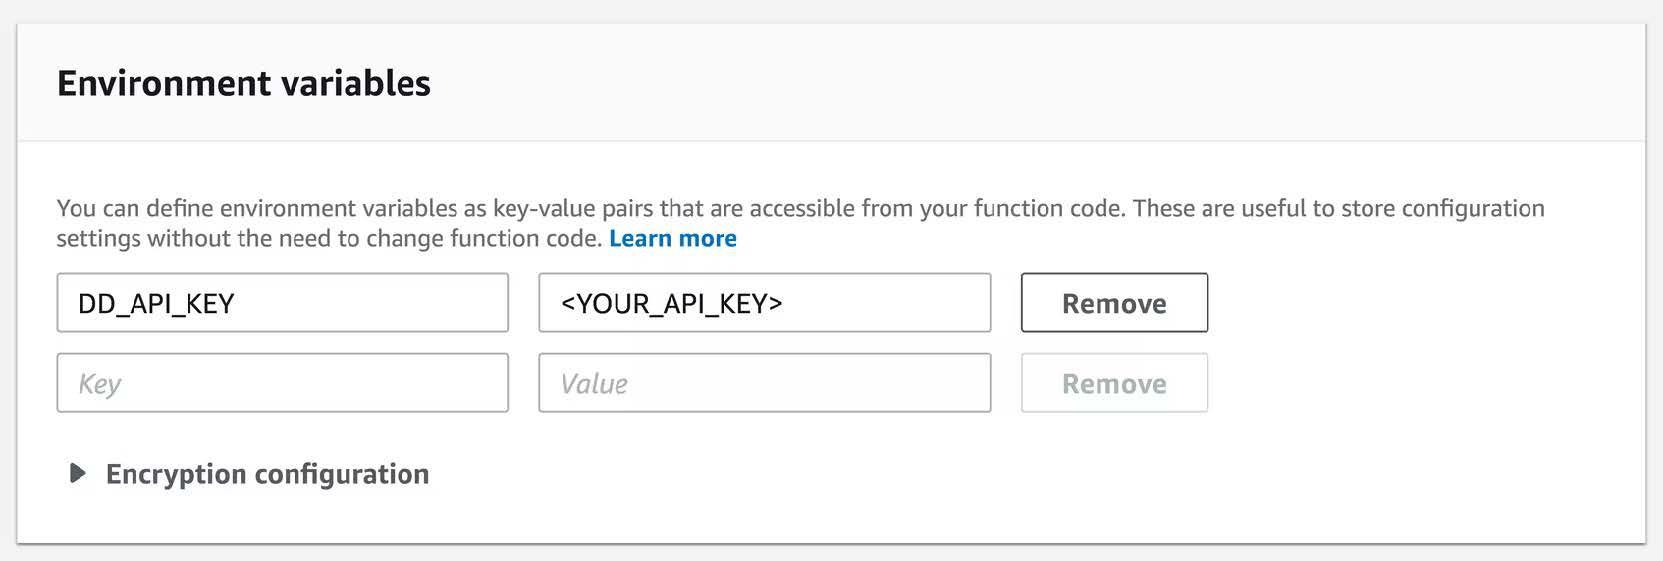
AddDeploy buttonAdd layer → arn:aws:lambda:<<your_region>>:464622532012:layer:Datadog-Python38:50Environment variables → add env variable in console named DD_API_KEY with an API key found at: https://app.datadoghq.com/organization-settings/api-keysAdd trigger → choose EventBridge (Cloud Watch Events) → schedule expression → use `cron(0,10,20,30,40,50 * ? * * *) as the expressionDeployThis is the section where the magic happens. We will cover how to create a customizable dashboard that lets you look at the historical pricing data in any way you want, how to create alerts for price changes in LINK and BTC, and how to create alerts when there are large drops or upswings in the amount of BTC/LINK bought (which could indicate a whale move). Gone will be the days of only being able to see prebuilt graphs of price data or only being able to have a set number of alerts set up. This section will give you control of the visualization of pricing data and alerting on it.
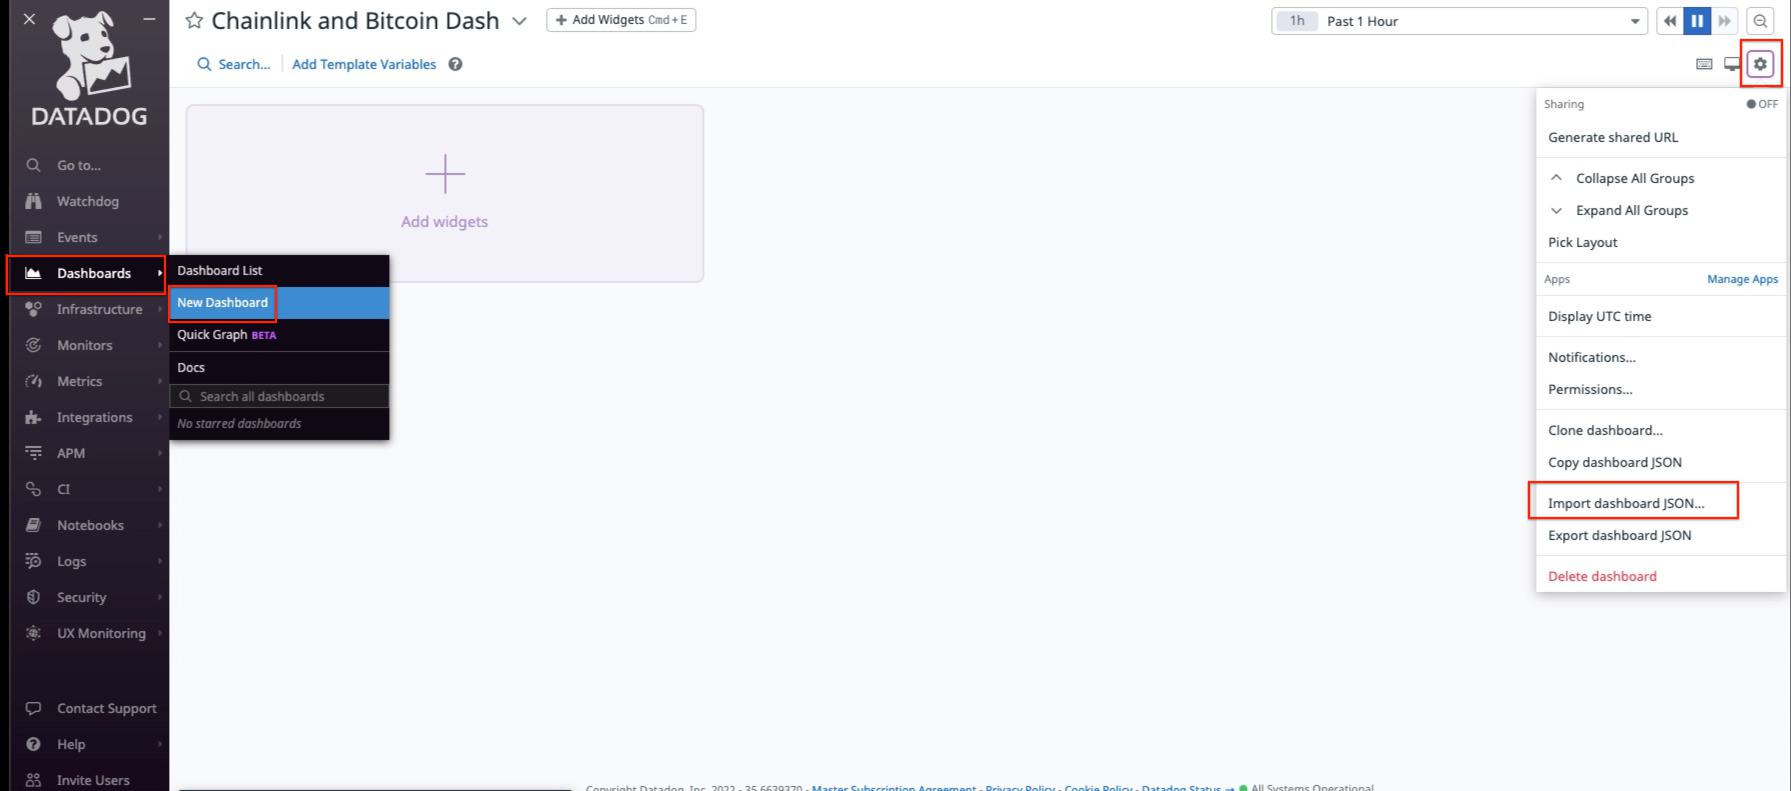
Dashboards sectionNew DashboardImport dashboard JSON

How much Chainlink has been bought in the last hour widget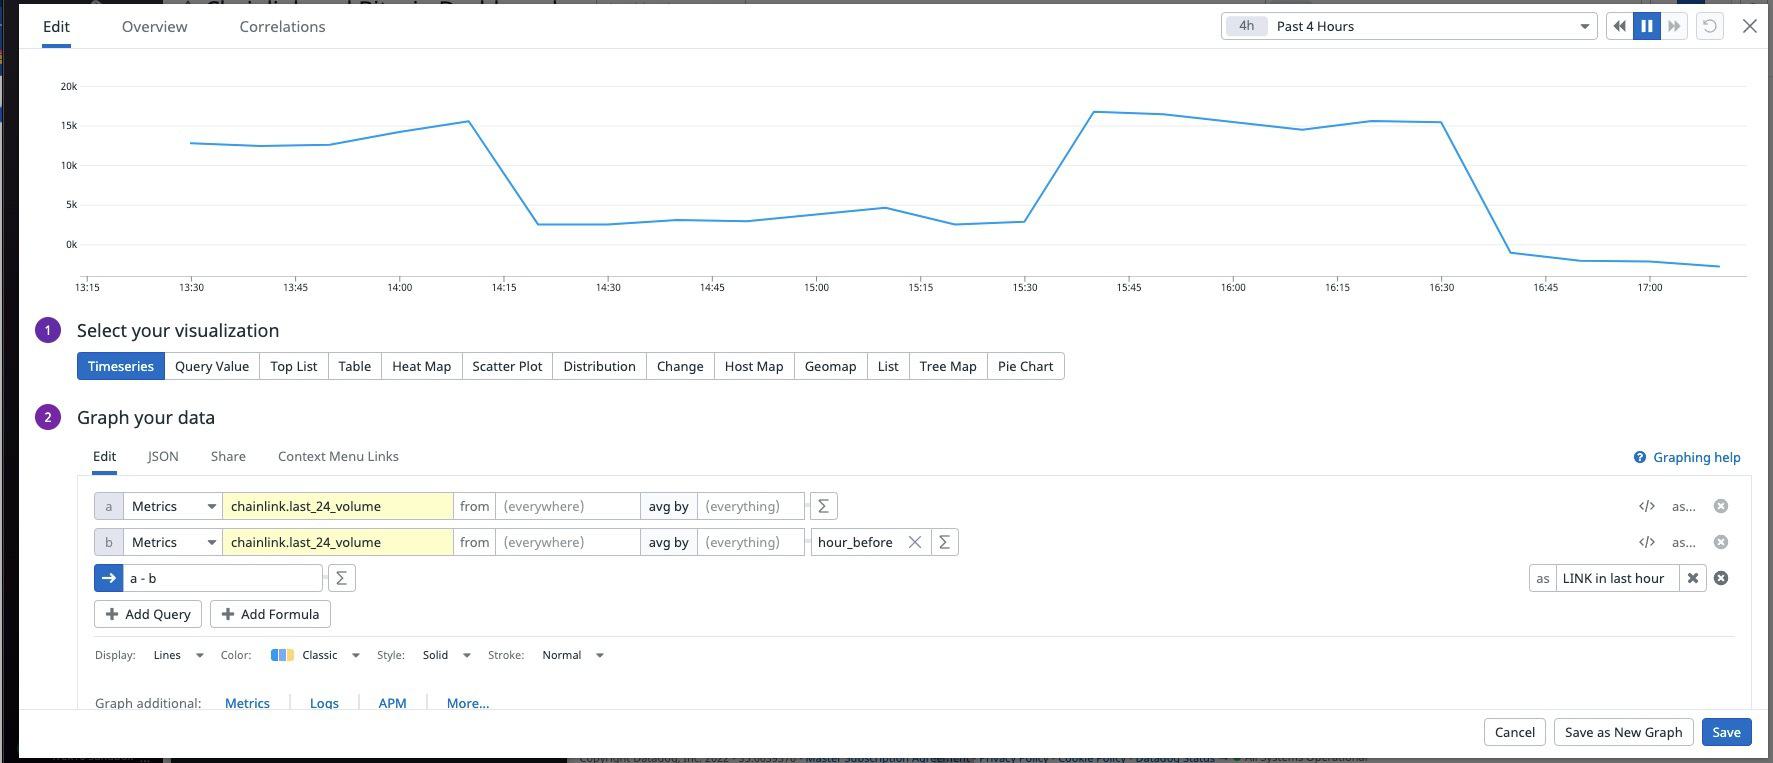
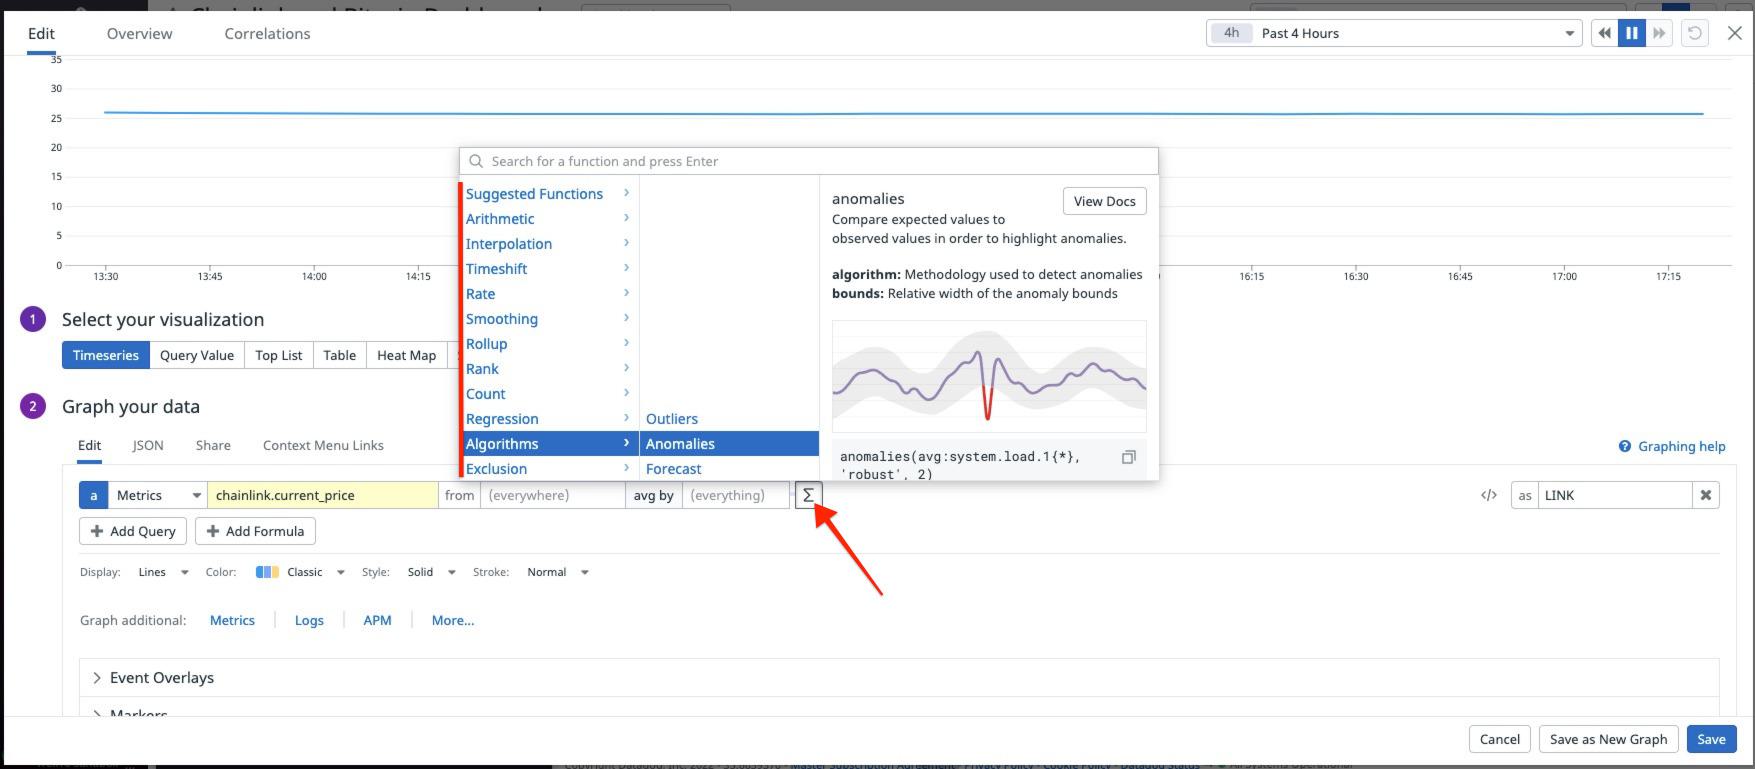
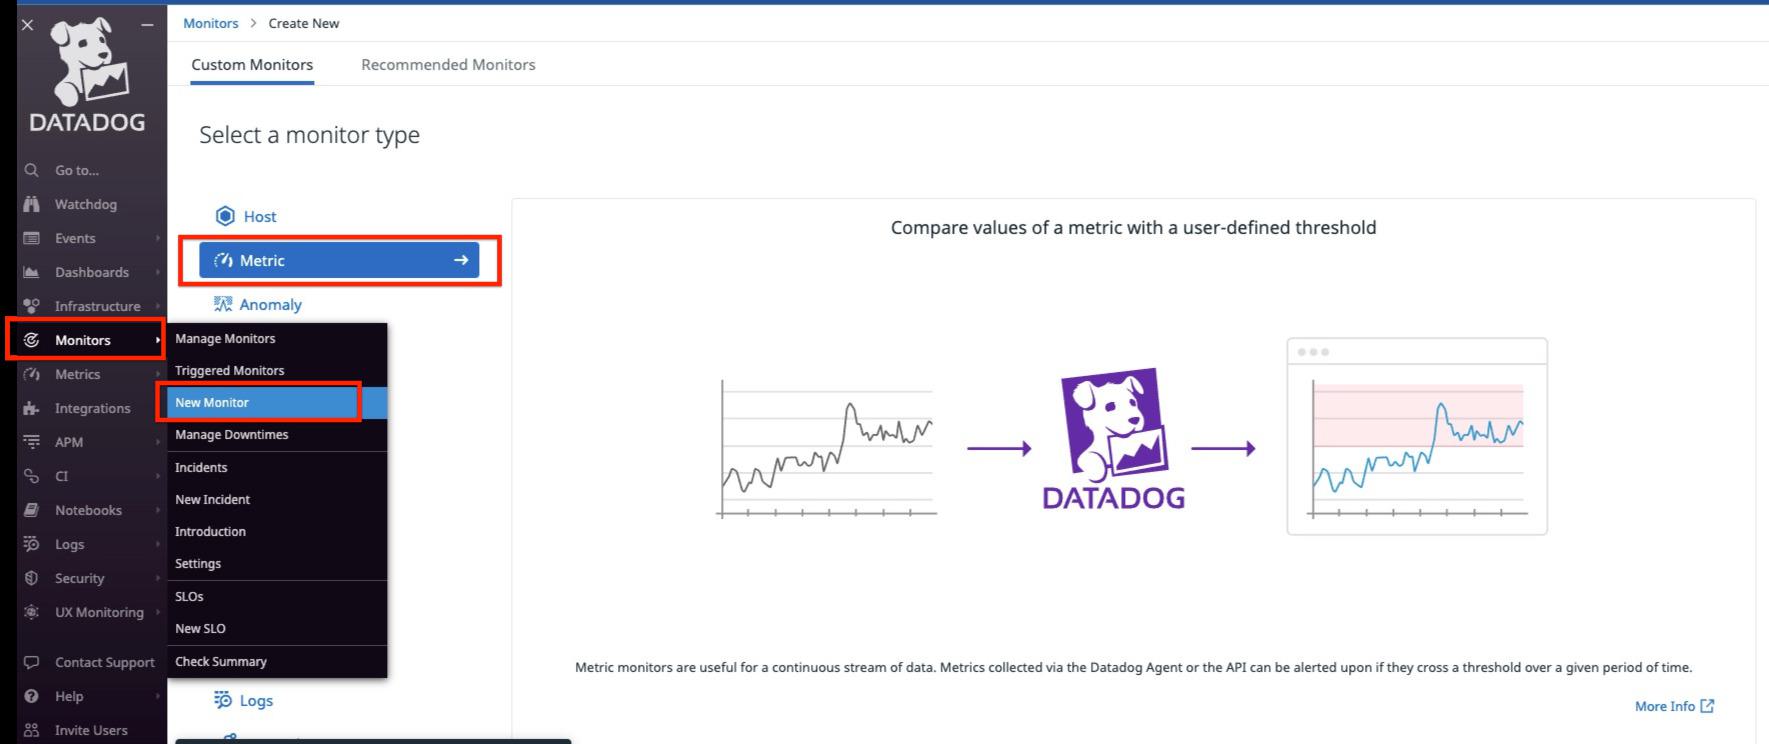
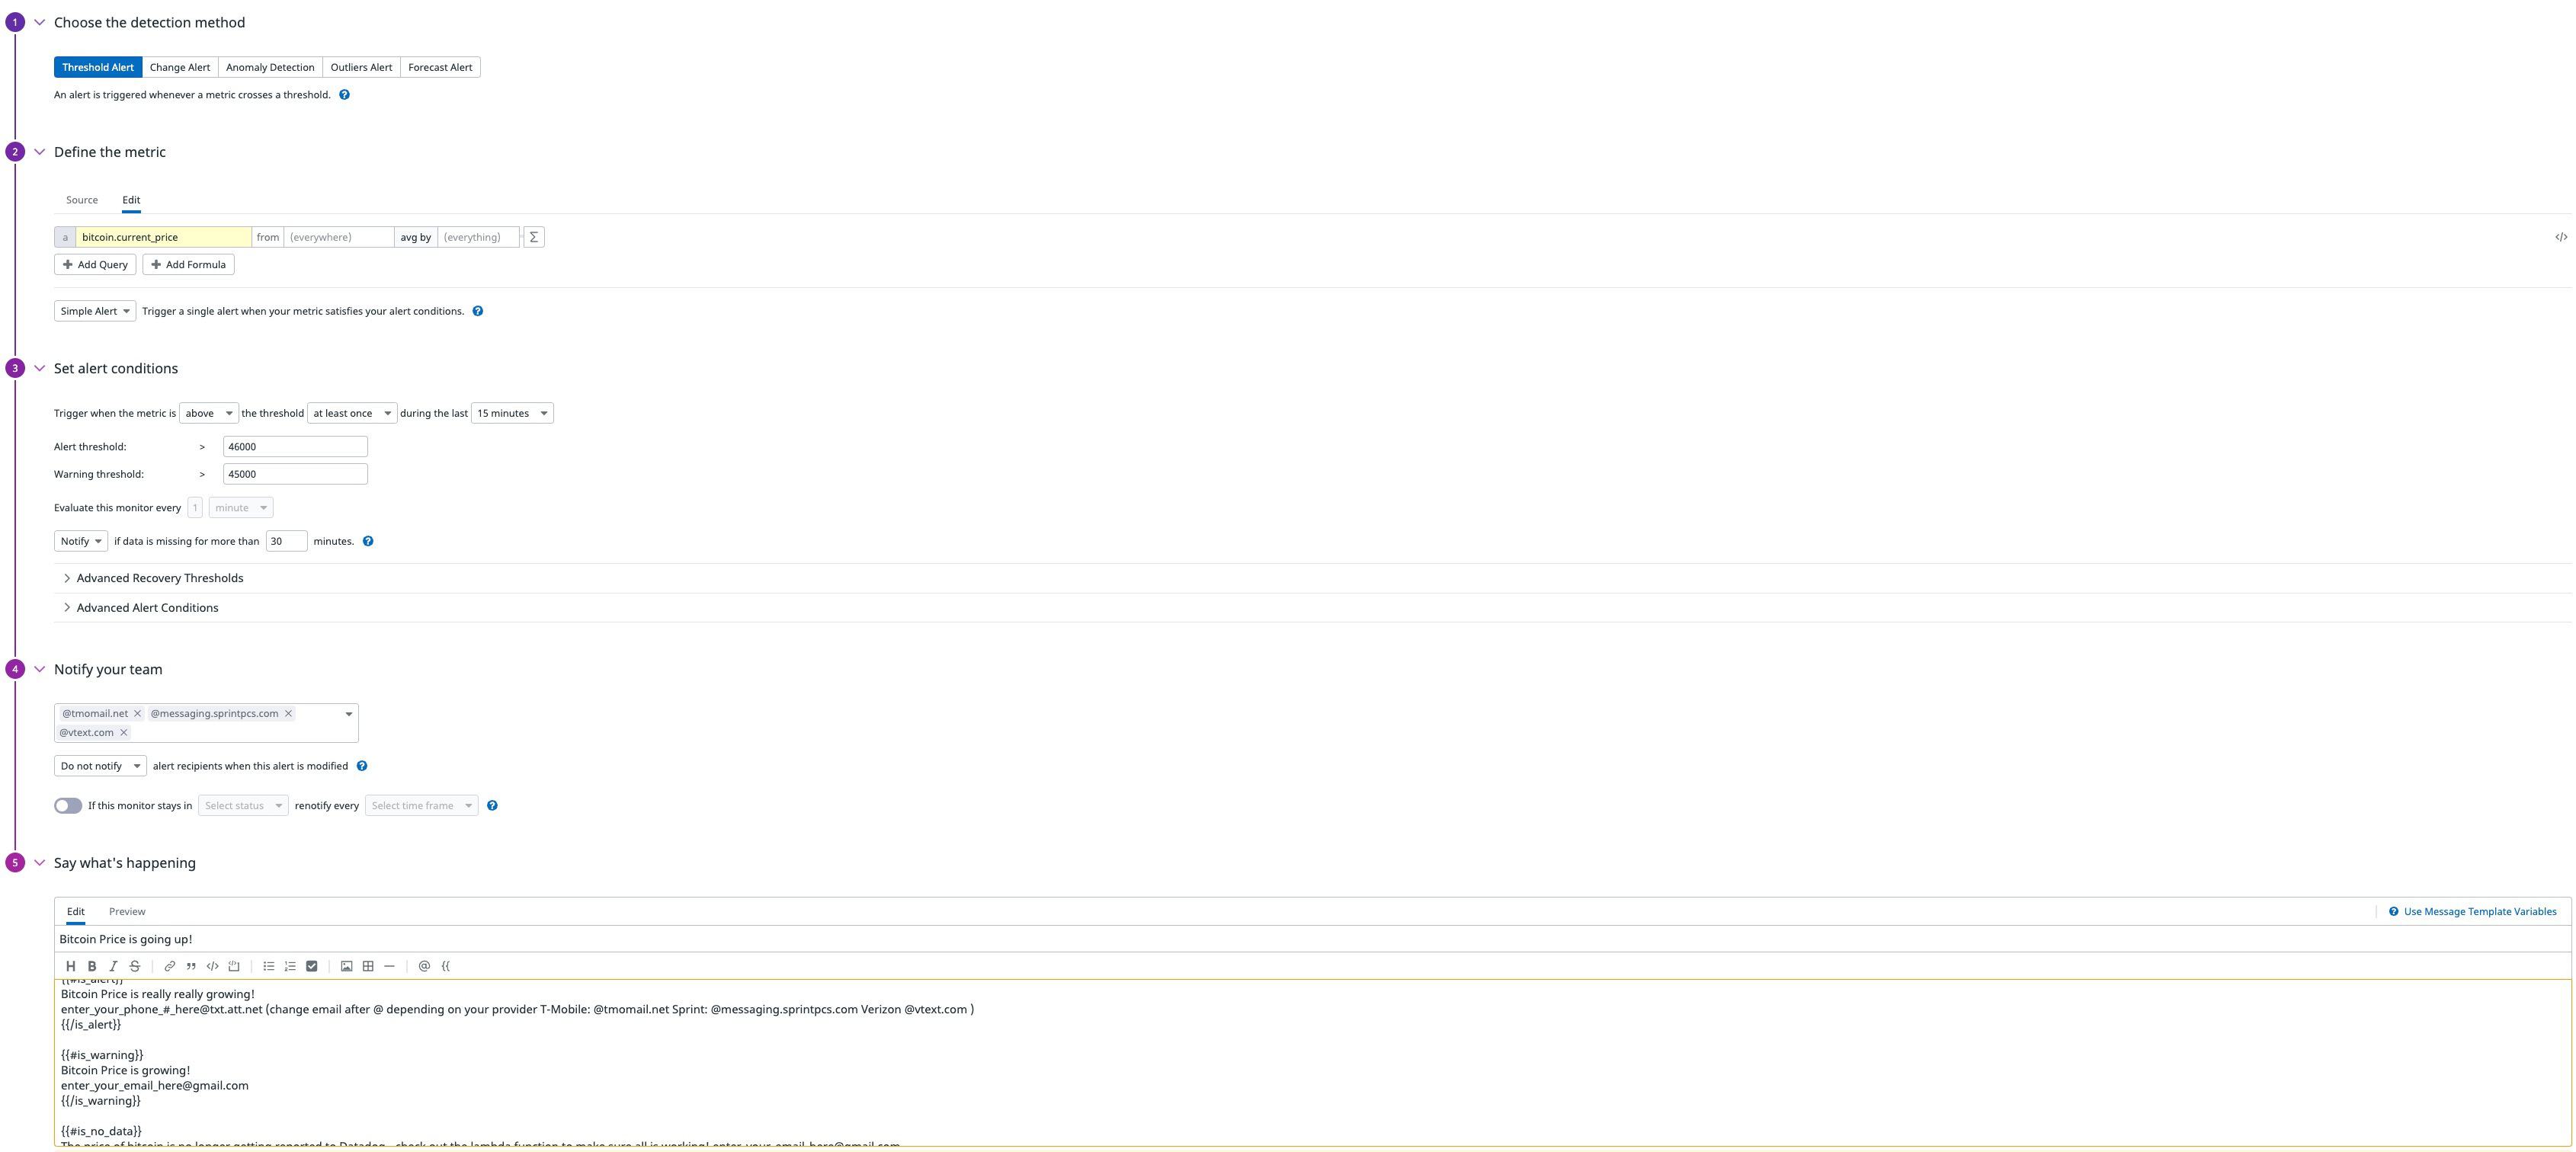
Choose the detection method select Threshold Alert Define the metrics start typing bitcoin.current_price (the option to autocomplete should pop up)Set alert conditions select when the metric is above / at least once and 15 minutesNotify if data is missing and select 30 minutes. We will use this to let us know if our lambda stops running for some reasonNotify your team as it is… we will be manually adding alerts in section 5.Section 5 the Say what's happening section. This section is what allows you to customize the message you send out and which notification endpoints get which messages. I would strongly recommend reading Datadog’s documentation to see all that is available to you.
{{#is_alert}}
Bitcoin Price is really really growing!
enter_your_phone_#_here@txt.att.net (change email after @ depending on your provider T-Mobile: @tmomail.net Sprint: @messaging.sprintpcs.com Verizon @vtext.com )
{{/is_alert}}

{{#is_warning}}
Bitcoin Price is growing!
enter_your_email_here@gmail.com
{{/is_warning}}

{{#is_no_data}}
The price of bitcoin is no longer getting reported to Datadog - check out the lambda function to make sure all is working! enter_your_email_here@gmail.com
{{/is_no_data}}
Import Monitor From JSONSo now we have accomplished the following: getting pricing information on LINK/BTC, getting that information from Kraken into Datadog via AWS, and visualizing and monitoring off of that data. Now all that is left is to figure out how much we are spending on this solution and extrapolate what this solution could do.
With less than one hour’s worth of effort, you can use Datadog to text you when the price of BTC/LINK drops. You could go on to create monitors based on anomaly detection for the price of LINK. Or you could even have one of those Datadog monitors invoke a webhook that calls another lambda function to execute a purchase order to buy more LINK. The powerful monitoring engine and dashboarding visualization tools are completely free once data is inside Datadog. Trek10 uses these tools to get our managed service clients real-time alerts about the health of their AWS account and even call webhooks to execute client runbooks.
If your company is looking for help implementing Datadog, building automatic remediation based on AWS events, or looking for someone to manage your AWS account for you - please contact our team by filling out the form located here. Trek10 is proud to be a Gold Datadog Partner and Managed Service Provider! Choose the right AWS consulting partner (hint: we think it's us).


Build an IPv6-to-IPv4 proxy using CloudFront to enable connectivity with IPv4-only AWS services.
